Export Raw Analytics Data from Cincopa
You can export detailed raw analytics data from Cincopa using API calls. This guide explains how to use the API, locate your account ID, and download raw analytics in CSV format
Let's get started 🚀
Prerequisites
Your Cincopa Account UID (unique account ID)
A web browser or any tool that can open CSV files
Get Your Cincopa UID
To export analytics, you need your Cincopa unique account ID (UID). It's tied to your account and tells Cincopa which dataset to return.
Keep your UID secure and do not share it publicly, as it can provide access to your analytics data.
Step 1: Log in to your Cincopa account and navigate to your Account Settings.
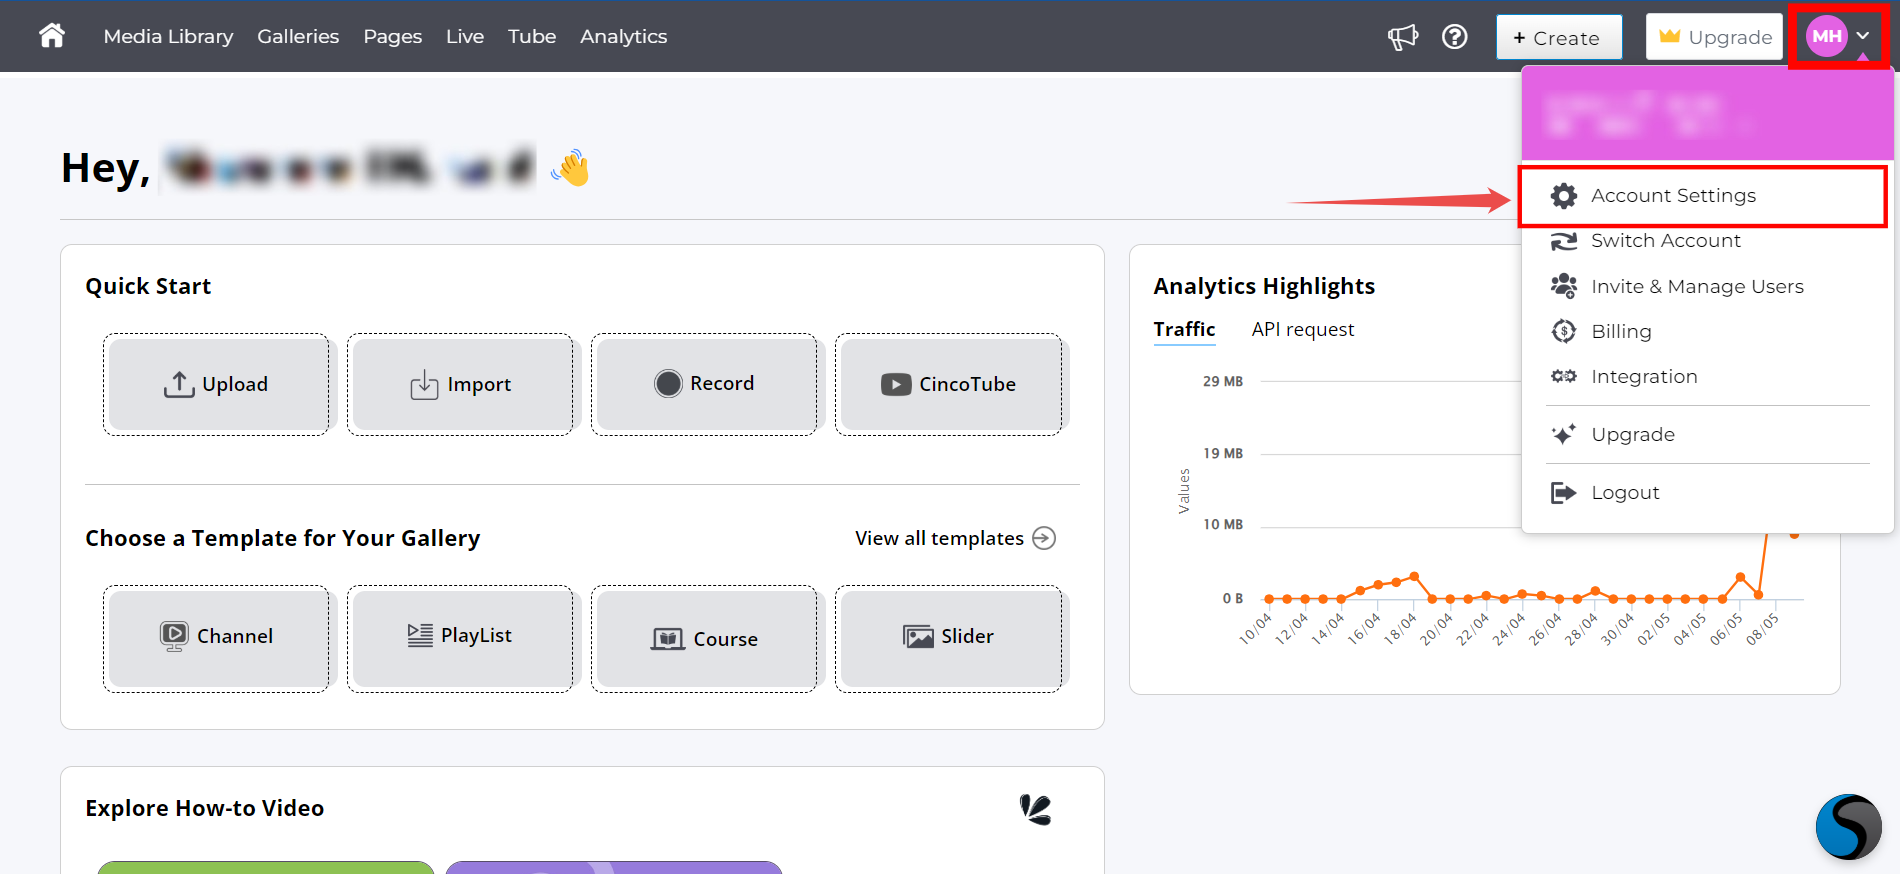
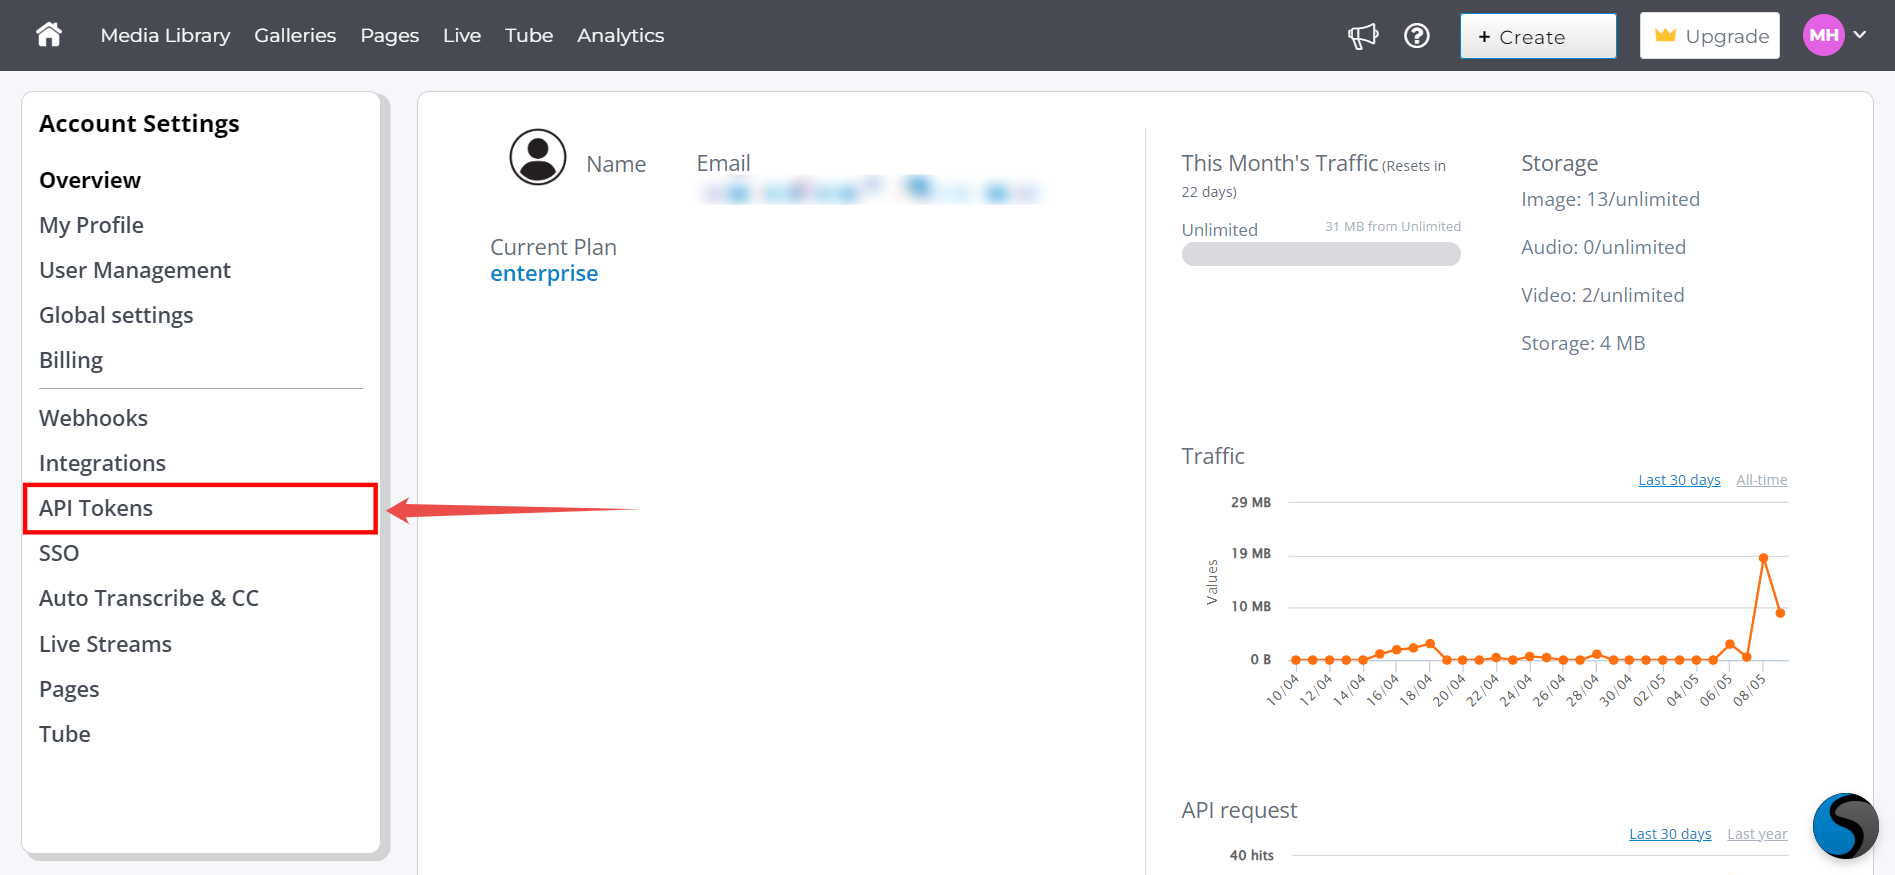
Step 2: Navigate to your API Token section and click on it.
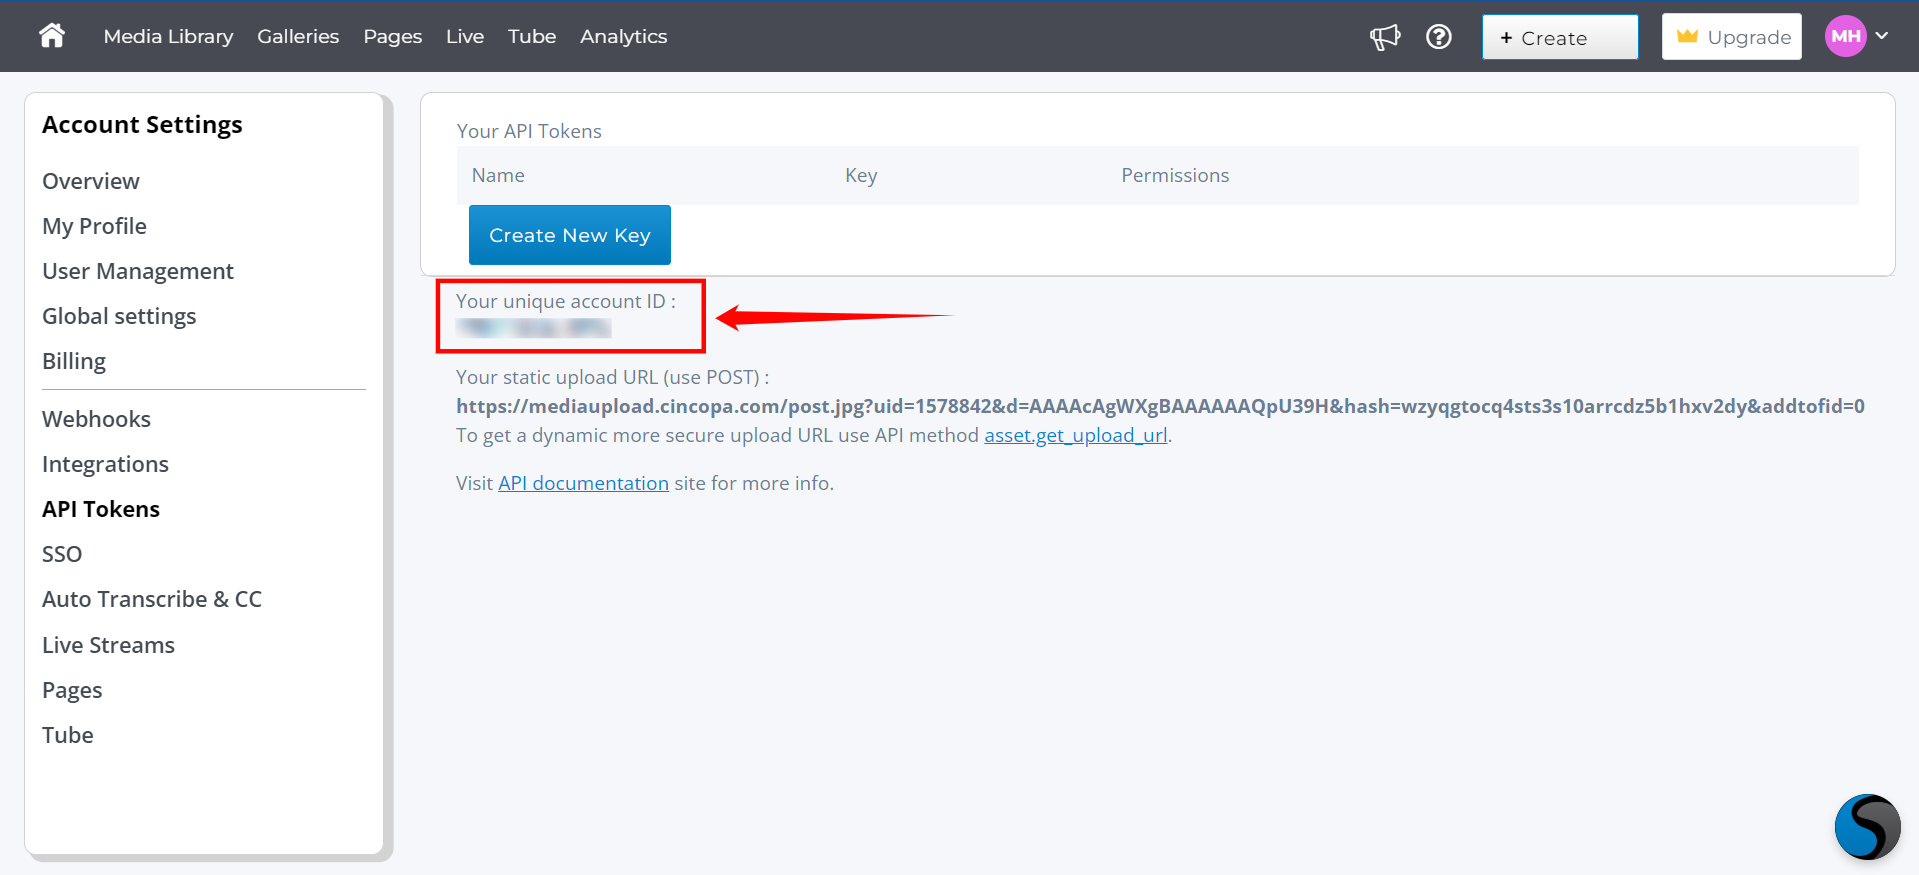
Step 3: Here you'll find "Your unique account ID" (e.g., A4AbePxwFKPJ).
Construct the Export URL
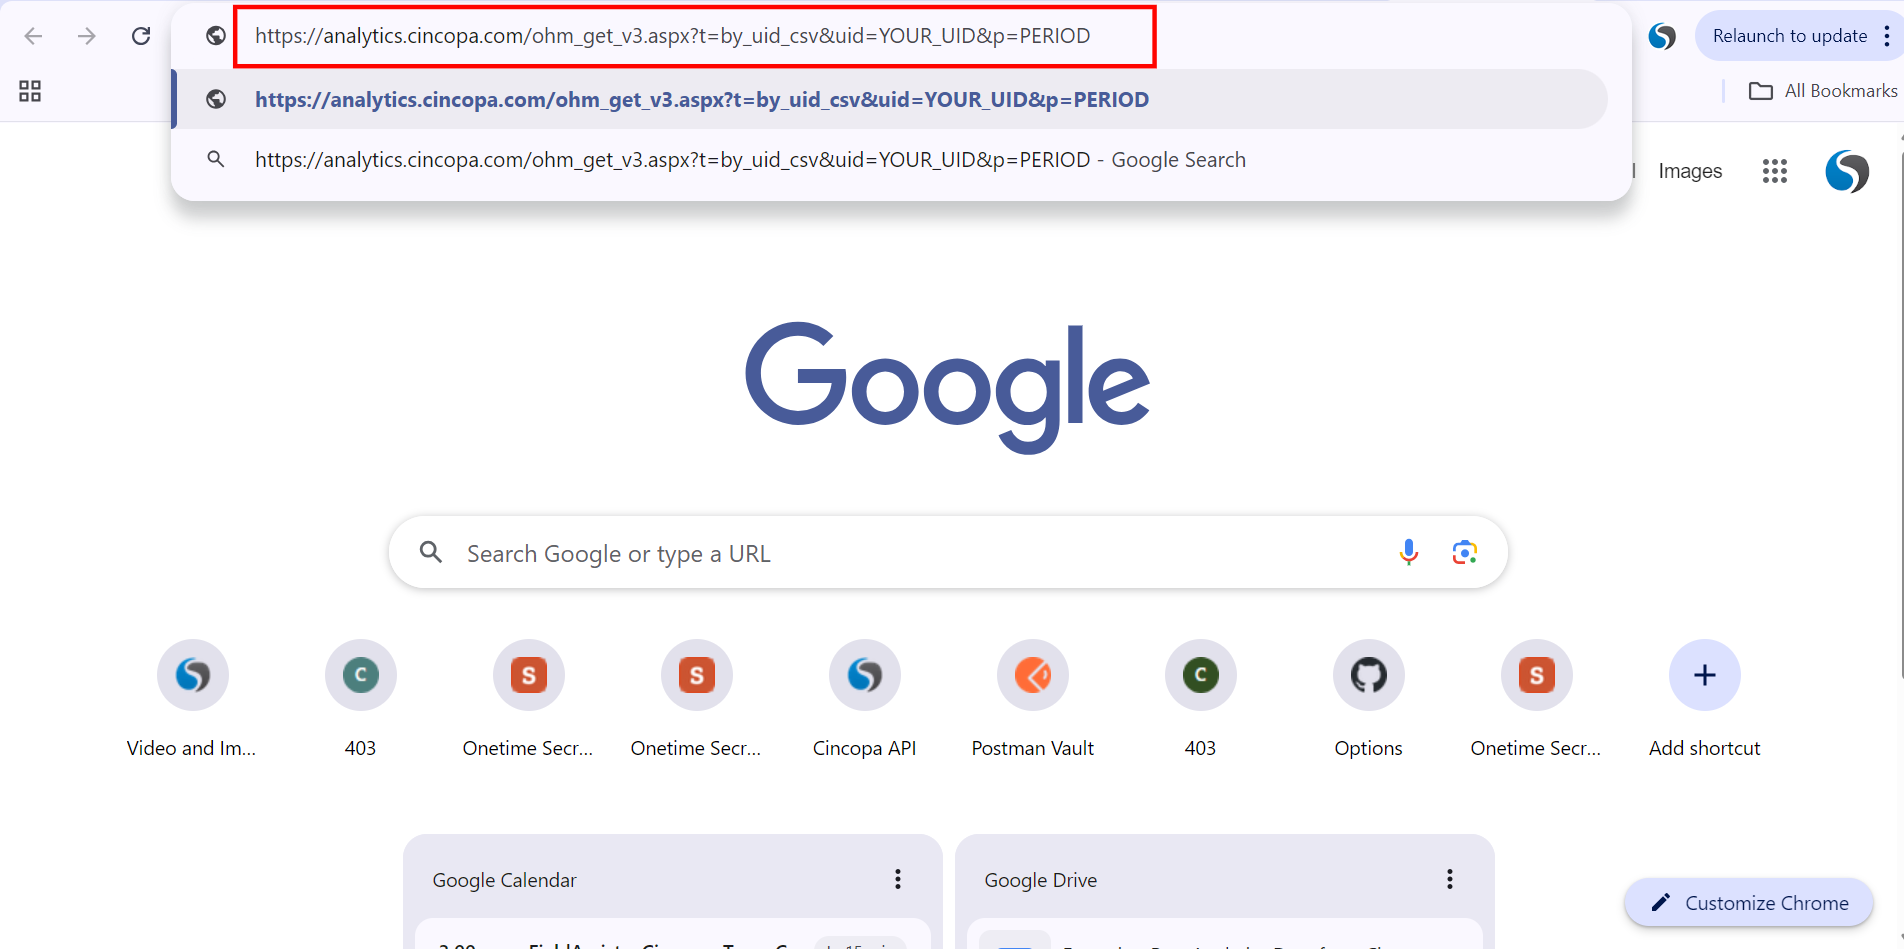
With your UID in hand, the next step is to build the export URL that will fetch your analytics data. This URL points to a hidden Cincopa endpoint that returns raw data in CSV format. Use the following URL format to generate your analytics CSV:
https://analytics.cincopa.com/ohm_get_v3.aspx?t=by_uid_csv&uid=YOUR_UID&p=PERIOD
Replace the placeholders:
YOUR_UID→ Your Cincopa account UID (e.g.,A4AbePxwFKPJ)PERIOD→ The time range in the formatdays-offsetExample:
6-0means the last 6 days including todayMax range:
31-0(maximum 31 days)
If you enter a range greater than 31 days, the API will not return data.
Download the CSV File
Once you've constructed the correct URL, follow these steps to export and open your analytics data:
Step 1: Copy the full URL you created (with your UID and period), paste it into your browser, and press "Enter".
If the link is valid and your UID is correct, the browser will automatically start downloading a .csv file. No login or additional credentials are required, as the UID in the link identifies your account. Once downloaded, you can open the file using Excel, Google Sheets, or any spreadsheet viewer.
Automating CSV Download and Parsing from Cincopa Analytics API
To automate the process of downloading and processing the CSV file from Cincopa's analytics API, a developer would:
Construct the URL: Build the correct URL that includes the necessary query parameters (like UID and period) to access the analytics data.
Send an HTTP GET request: Use an HTTP client to send a GET request to the constructed URL.
Download the CSV file: Capture the response, which will contain the CSV file content, and save it locally or process it in-memory.
Parse the CSV: Read the CSV file line by line, split the data by commas, and process each row as needed (e.g., storing the data in a database or performing calculations).
This can be done in most programming languages using HTTP libraries to handle the download and basic string manipulation or specialized libraries to parse CSV data.
CSV File Structure
When you download the analytics CSV file, it will include the following fields:
| Fields | Description |
|---|---|
| time | UTC time |
| hmid | This is the specific heat map Id |
| ckid | This is the viewer unique Id. This is how Cincopa identify the user |
| unique | True if this is the first time this ckid is watching this video, false if not |
| ud_email | user-defined email |
| ud_acc_id | account id |
| ud_name | account name |
| prg | how many seconds were watched in total |
| lat | Latitude of viewer (by his IP) |
| long | Longitude of viewer (by his IP) |
| ip | viewer IP address |
| rid | video ID |
| country,city | the country and city of the viewer (by his IP) |
| dur | Total length of the video in seconds |
| url | URL where the video was watched |
| ua | the browser’s User-Agent |
| name | The name of the video |
| hm | Ha comma-separated list of rangers in seconds that indicates which parts of the video this viewer has watched. Each value can also be a range for example “10-20,30-40” means that user watched from second 10 to 20 and then skipped to second 30 and watched until second 40 (total of 11 seconds). In case, a user watched a specific second or a range more than one time then a colon will be used for example “10-20:2,21-30,31:3” means that user watched second 10 to 20 twice, 21-30 one time and second 31 was watched 3 times.In order to calculate what percentage of the video user actually watched you can take the total unique seconds (seconds that were watched at least once) and divided by the dur (duration) value. For example in “10-20:2,21-30,31:3” total watched seconds were 11+10+1=22. Assume that the dur of the video was 40 seconds then 22/40=55%. |